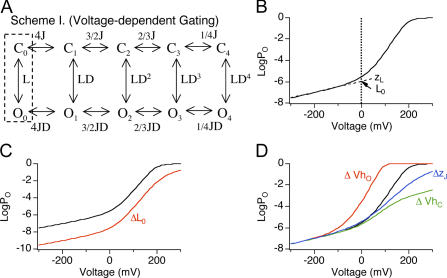
Figure 2.
Effects on 0 Ca2+ logPO-V relation by changes in L0, VhO, VhC, and zJ. (A) BK channel gating scheme at 0 Ca2+ according to the HA model. Channel resides in either open (O) or closed (C) conformation, with zero to four (subscripts) activated (A) voltage sensors. L is the C-O equilibrium constant with all four voltage sensors in the resting (R) state (dashed box). J is the R-A equilibrium constant when channels are closed. D is the allosteric interaction factor between C-O transition and voltage sensor activation. Equilibrium between C-O transitions is allosterically regulated by the states of four independent and identical voltage sensors. (B) Simulated 0 Ca2+ logPO-V relation according to the HA model (L0 = 1 e−6, zL = 0.30 e0, zJ = 0.58 e0, VhC = +200 mV, VhO = +50 mV). Dashed line represents linear fit of the logPO-V relation at the limiting slope. L0 (point where dashed line and zero line cross) and zL (slope of dashed line) are the zero voltage value of L and its partial charge, respectively. (C) Effects on logPO-V relation of changing L0 from 1 e−6 (black) to 1 e−8 (red). Notice the shift of the limiting slope along the Y axis. (D) Effects on logPO-V relation of changing VhO (−50 mV, red), VhC (+100 mV, green), or zJ (0.4 e0, blue) and leaving other parameters the same as in B (black). Notice reducing VhO, but not VhC or zJ shifts the steep phase of the logPO-V relation to more hyperpolarized potentials.

