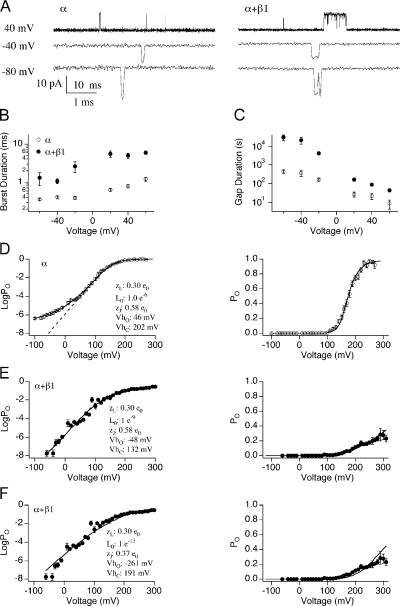
Figure 3.
Evaluating effects of mβ1 on L0 and VhO in the presence of wild type α. (A) Representative single channel currents of BK/α (left) and BK/α+β1 (right) in 0 Ca2+. Time scales are 10 ms for +40 mV and 1 ms for −40 and −80 mV, respectively. (B) Burst duration (mean ± SEM) versus voltage for BK/α (n = 5–10) and for BK/α+β1 (n = 3–13). (C) Gap duration (mean ± SEM) versus voltage for BK/α (n = 5–10) and for BK/α+β1 (n = 3–13). (D) LogPO-V (mean ± SEM, left) and PO-V relations (mean ± SEM, right panel) of BK/α. PO between −120 and +100 mV were measured using single channel recordings (n = 2–13). PO between +110 and +290 mV were measured using macroscopic recordings (n = 12). Linear fit of logPO–V relation at the “steep phase” (dashed line, left) indicates that the measurement either has reached or is approaching the limiting slope. The solid line represents best fits to the HA model (held zL = 0.3 e0, zJ = 0.58 e0, fitting yielded L0 = 1 e−6, VhC = +202 mV, and VhO = 46 mV). (E) LogPO-V (mean ± SEM, left) and PO-V relations (mean ± SEM, right) of BK/α+β1. PO between −60 and +80 mV were measured using single channel recordings (n = 4–22). PO between +90 and +310 mV were measured using macroscopic recordings (n = 7). Linear fit of logPO–V relation at the “steep phase” (dashed line, left panel overlaps with the solid line) indicates that the measurement has not reached the limiting slope. Fits to the HA model were not well constrained, reasonable fits were obtained when L0 ranged between 1 e−10 and 1 e−8. The solid line represents one of the fits (held L0 = 1 e−9, zL = 0.3 e0, zJ = 0–0.58 e0, fitting yielded VhC = +132 mV and VhO = −48 mV). (F) Reducing zJ did not improve the fits. Best fits (solid lines) to the HA model (held zJ = 0.37 e0, zL = 0.3 e0, L0 > 1 e−13, yielded L0 = 1e−13, VhC = +192 mV, and VhO = −261 mV).

