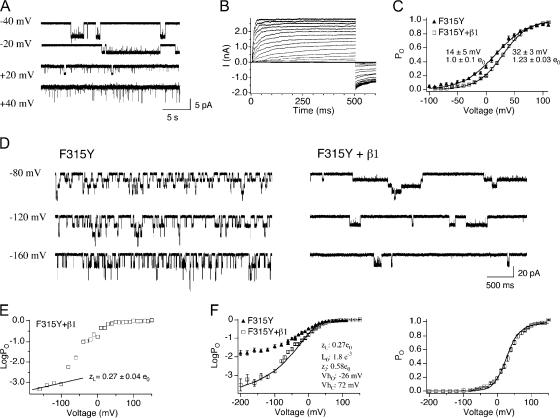
Figure 5.
Evaluating effects of mβ1 on L0 and VhO in the presence of F315Y. (A) An example of single channel recordings of BK/F315Y+β1 at 0 Ca2+. Notice that maximum PO reaches ∼1. (B) Representative macroscopic recordings of BK/F315Y+β1 at 0 Ca2+. (C) G-V relation (mean ± SEM) for BK/F315Y (n = 13) and BK/F315Y+β1 (n = 28). (D) Representative single channel recordings for BK/F315Y and BK/F315Y+β1. Notice that β1 dramatically increases the burst durations. (E) Representative logPO-V relations of BK/F315Y+β1 where the limiting slope were fitted to Eq. 4 to estimate zL, and L0 values indicated in the figure represent mean ± SEM (n = 7). (F) Best fits to the HA model (held zJ = 0.58 e0, zL = 0.27 e0 yielded L0 = 1.8 e−3, VhC = +72 mV, and VhO = −26 mV).

