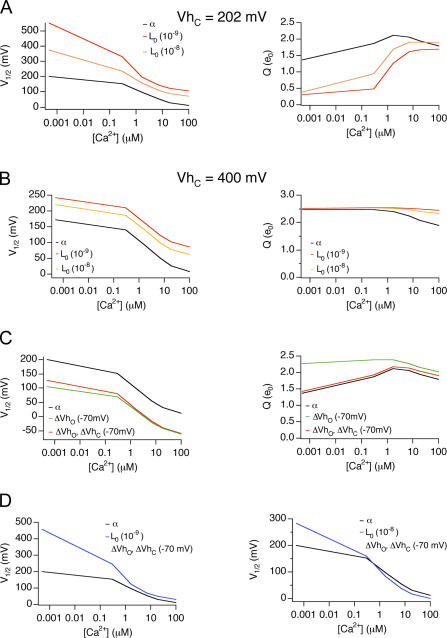
Figure 6.
Effects on V1/2-Ca2+ relations of changing L0, VhO, or J0. (A) Effects on V1/2-Ca2+ and Q-Ca2+ relations by changing L0. PO-V relations were simulated based on the HA model and fitted to the Boltzmann function to obtain V1/2-Ca2+ relations. Gating parameters were the same (zL = 0.30 e0, zJ = 0.58 e0, VhC = +200 mV, VhO = +50 mV, KC = 13 μM, KC = 1.3 μM) except for L0 (L0 = 1 e−6, black line; L0 = 1 e−8, orange line; L0 = 1 e−9, red line). (B) Effects on V1/2-Ca2+ and Q-Ca2+ relations by changing L0 when VhC is +400 mV. Gating parameters are same as A except VhC is +400 mV. (C) Effects on V1/2-Ca2+ and Q-Ca2+ relations by changing VhO or J0. Gating parameters were the same (zL = 0.30 e0, L0 = 1 e−6, zJ = 0.58 e0, KC = 13 μM, KC = 1.3 μM) except for VhC and VhO, (VhC = +200 mV, VhO = +50 mV, black line; VhC = +200 mV, VhO = −20 mV, solid green line, VhC = +130 mV, VhO = −20 mV, green dash line). (D) Effects on V1/2-Ca2+ relations by changing JO and L0. Black lines (L0 = 1 e−6, VhC = +200 mV, VhO = +50 mV, other parameters as in A); blue line, left (L0 = 1 e−9, VhC = +130 mV, VhO = −20 mV); blue line, right (L0 = 1 e−8, VhC = +130 mV, VhO = −20 mV).

