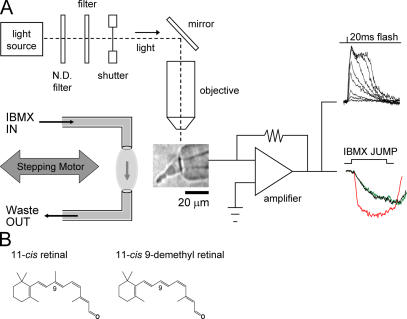
Figure 1.
Schematic representation of the experimental set-up and retinals used in this study. (A) A photographic image of a salamander red cone photoreceptor, drawn inner segment first into a glass pipette, is shown in the middle of the figure. The pipette is connected to a patch clamp amplifier, the output of which measures electrical responses of the cell to light stimulus (superimposed flash responses, top right). The light source used for test flashes and bleaching is shown at the top left. GC rates were determined by measuring current changes when cells were briefly exposed to a solution containing 500 μM IBMX, a PDE inhibitor. This device (shown to the left of the cone) consisted of two pipettes mounted to a micromanipulator and connected to a computer-driven stepping motor. The three superimposed traces to the right of the amplifier are shown for illustration sake only and represent typical jump recordings from a cell in the dark-adapted (black), bleached (red), and regenerated states (green; see Fig. 7 for further details). ND, neutral density. (B) Structure of retinals are shown. Left, 11-cis retinal; right, 11-cis 9-demethyl retinal is an analogue lacking the methyl group at the 9-carbon position.

