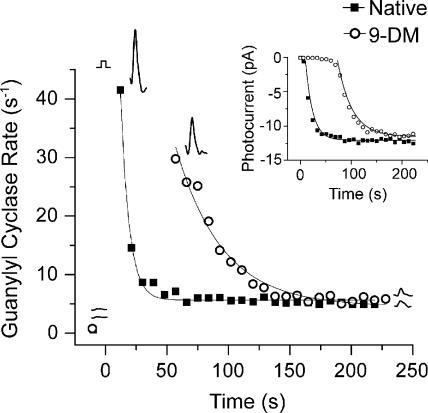
Figure 8.
The effect of 11-cis 9-demethyl retinal on the time course of GC rate recovery after bleaching a single red cone. Each data point represents one measurement of the cyclase rate plotted as a function of time after >90% bleach. Closed squares represent individual rate measurements when the cone contained native pigment; open circles represent individual rate measurements when the cone contained 11-cis 9-demethyl retinal (9-DM). Data were fitted with single exponential functions. The experiment was repeated in four other cells. The mean time constant for GC recovery in the cells containing native pigment is τGC = 8.50 ± 1.24 s (±SEM; n = 5), and, in cells containing 9-demethyl retinal, the mean is τGC = 37.0 ± 6.48 s (±SEM; n = 5). Inset shows the time course of recovery of flash response amplitude (measured as in Fig. 2 B) for the same cell.

