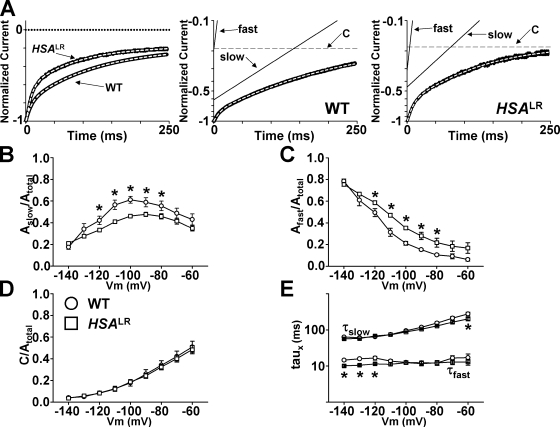
Figure 5.
Deactivation kinetics of ClC-1 currents in FDB fibers obtained from WT and HSA LR mice. (A) Superimposed traces of normalized ClC-1 current deactivation (solid lines) elicited at −100 mV in FDB fibers obtained from 19-d-old WT and HSA LR mice and fit with a second order exponential (left; white dashed lines). ClC-1 currents from representative WT (middle) and HSA LR (right) FDB fibers fit with a biexponential function and replotted on log-linear plots. Fractional amplitudes of the extracted slow, fast, and nondeactivating components of the currents are shown for clarity. (B–D) Voltage dependence of the average relative contribution of the slow (B), fast (C), and steady-state (D) components of ClC-1 deactivation in FDB fibers obtained from 18–20-d-old WT (open circles, n = 8) and HSA LR (open squares, n = 16) mice. (E) Voltage dependence of the fast and slow time constants of ClC-1 deactivation in FDB fibers obtained from 18–20-d-old WT (open circles, n = 8) and HSA LR (open squares, n = 16) mice. *, P ≤ 0.05.

