Figure 6.
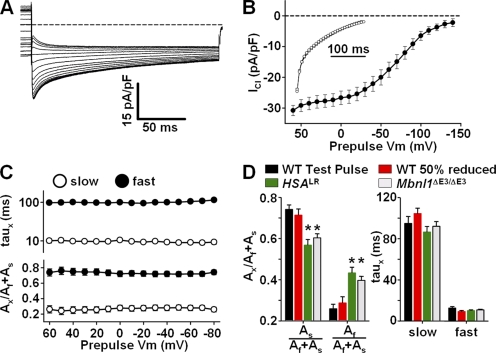
Kinetics of ClC-1 deactivation after prepulse-dependent current reduction. (A) Representative family of ClC-1 currents (at−100 mV) recorded from an FDB fiber obtained from a 19-d-old WT mouse after 200-ms prepulses to potentials ranging from +60 to −140 mV (in 10-mV increments). (B) Voltage dependence of average time-dependent currents (Afast+Aslow) after prepulse-dependent current reduction. (Inset) Normalized ClC-1 currents (solid lines) fit with a second order exponential in control (60 mV prepulse; circles) and after ∼50% (average = 48.8 ± 0.1%, n = 8) reduction in current magnitude (−70 mV prepulse; squares). Black dashed line indicates the zero current level. (C, bottom) Voltage dependence of the average relative contribution of the fast (closed circles) and slow (open circles) components of ClC-1 deactivation (C, lower) and their respective time constants (C, top). (D) Average relative contribution of the fast and slow components of the time-dependent current (Afast+Aslow) and their respective time constants to ClC-1 deactivation (at −100 mV) in FDB fibers obtained from WT mice (+60 mV prepulse; black, n = 8), WT mice after ∼50% reduction in ClC-1 current magnitude (−70 mV prepulse; red, n = 8), HSA LR mice (+60 mV prepulse; green, n = 14), Mbnl1 ΔE3/ΔE3 mice (+60 mV prepulse; white; n = 11). *, P ≤ 0.05 compared with WT +60 mV prepulse.

