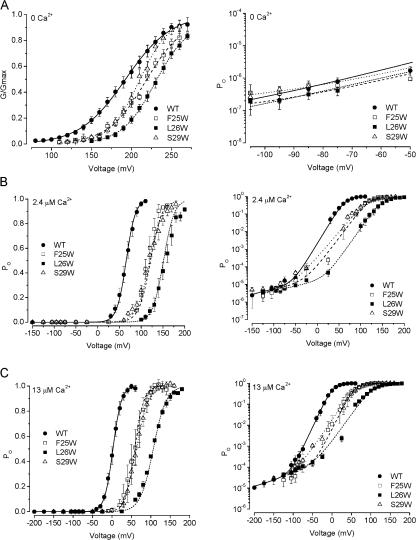
Figure 4.
The shifts in V1/2 observed with F25W, L26W, and S29W seem to arise from altered voltage sensing. (A) G-V relationships obtained at nominally 0 Ca2+ on linear coordinates (left), and PO measured from wild-type and mutant channels at negative voltages, on semilogarithmic coordinates (right). G-V data from F25W, L26W, and S29W show rightward shifts compared with wild type, suggesting that the Ca2+ sensor does not play an obligatory role in these mutation effects. Lines show Boltzmann fits with the parameters: WT V1/2 = 192 mV, z = 0.97 e0 (solid line); F25W V1/2 = 218, z = 1.2 e0 (dashed line); L26W V1/2 = 229, z = 1.2 e0 mV/e-fold change (short dash); S29W V1/2 = 209, z = 1.4 e0 (dotted line). PO data (right) were fitted with Eq. 1, with the Boltzmann parameters given above and the following L0 values: WT, 1.5 × 10⁻⁷; F25W, 2.10−7; L26W, 3.3 × 10⁻⁸; S29W, 4.7 × 10⁻⁷ (zL was fixed at 0.21 e0 for these fits). (B and C) G-V relationships obtained at 2.4 and 13 μM Ca2+, respectively, plotted on linear (left) and semilogarithmic coordinates (right). Limiting open probabilities measured at negative voltages for these two mutants were not different from wild type (see Results), illustrating that the mutation effects are not apparent when voltage sensors are deactivated. Smooth curves show fits with Eq. 1. Parameters for 2.4 μM Ca2+ were as follows: WT V1/2 = 65.6 mV, z = 2.4 e0, L0 = 2.3 × 10⁻⁵, zL = 0.36 e0; F25W V1/2 = 122 mV, z = 1.9 e0, L0 = 2.3 × 10⁻⁵, zL = 0.40 e0; L26W V1/2 = 151 mV, z = 2.1 e0, L0 = 1.5 × 10⁻⁵, zL = 0.33 e0; S29W V1/2 = 119 mV, z = 1.7 e0, L0 = 2.7 × 10⁻⁵, zL = 0.41 e0. Parameters for 13 μM Ca2+ were as follows: WT V1/2 = 2.46 mV, z = 2.4 e0, L0 = 1.7 × 10⁻⁴, zL = 0.33 e0; F25W V1/2 = 60.4 mV, z = 2.6 e0, L0 = 3.0 × 10⁻⁴, zL = 0.40 e0; L26W V1/2 = 106 mV, z = 1.5 e0, L0 = 2.0 × 10⁻⁴, zL = 0.33 e0; S29W V1/2 = 62.9 mV, z = 1.6 e0, L0 = 1.5 × 10⁻⁴, zL = 0.31 e0.

