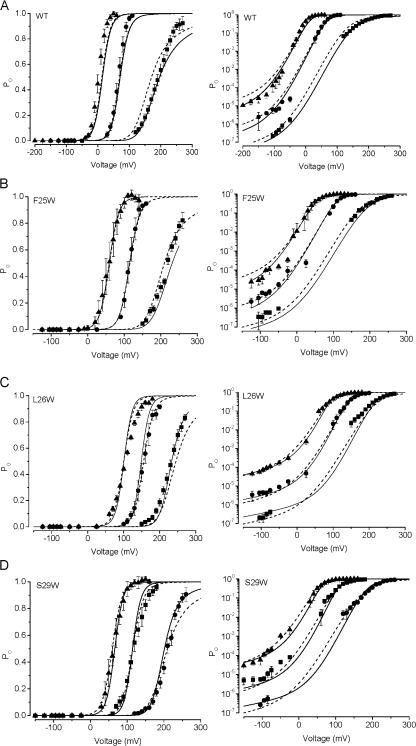
Figure 5.
Description of wild-type and S0 mutant BK channel data with the dual allosteric model. Each dataset is plotted on both linear (left) and semilogarithmic coordinates (right). (A) Wild-type channel activity as a function of voltage at nominally 0 (squares), 2.4 μM (circles), and 13 μM Ca2+ (triangles). Smooth curves were generated using the parameters of Fit A (solid line) and Fit B (dashed line), presented in Table I. (B–D) Activity of F25W, L26W, and S29W, respectively, with symbols corresponding to 0, 2.4, and 13 μM Ca2+ as in A. Solid and dashed lines were generated with the dual allosteric model using parameters as described in Results.

