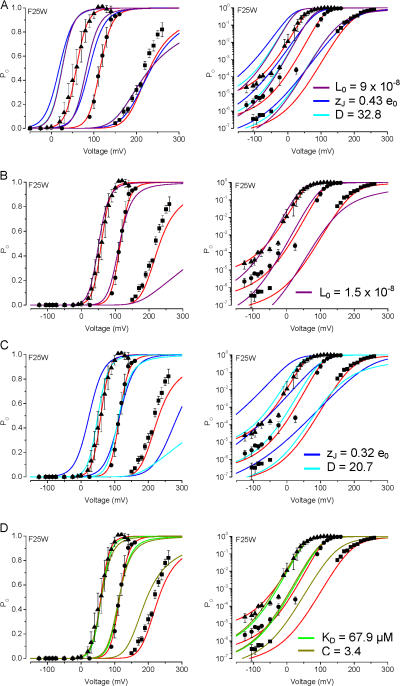
Figure 7.
Description of F25W mutant channel data with the dual allosteric model. In each plot, F25W channel activity is shown as a function of voltage with symbols as in Fig. 5. As with Fig. 6, parameters from the dual allosteric model for WT channel activation (Table I) were changed individually to arrive at the best fit to the mutant data. The graphs illustrate the comparison of models using Fit A parameters with J0 = 0.017 (solid red curve) vs.: (A) L0 = 9.0 × 10⁻⁸ (solid purple), zJ = 0.43 e0 (solid blue), or D = 32.8 (solid cyan); (B) L0 = 1.5 × 10⁻⁸ (solid purple); (C) zJ = 0.32 e0 (solid blue), or D = 20.7 (solid cyan); and (D) KD = 67.9 μM (solid green), or C = 3.4 (solid olive).

