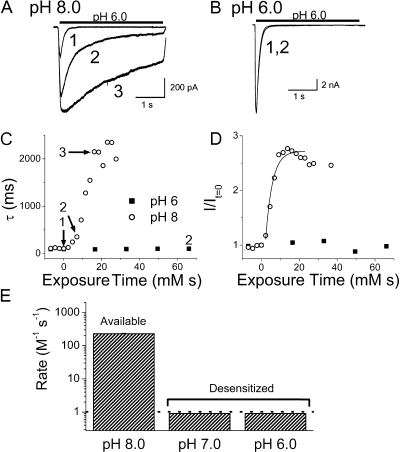
Figure 4.
MTSES reaction rate at E79C. (A) Currents from E79C channels before application of MTSES (1), and 35 s (2), or 81 s (3) after exposure to 200 μM MTSES at pH 8.0. The increase in amplitude at pH 8.0 was caused by MTSES because it shifts the steady-state desensitization curve of E79C to the right (not depicted). (B) Before and after 5 min in 1 mM MTSES at pH 6; there is no evident change when MTSES is applied to desensitized channels. (C and D) Modification as a function of exposure time (time exposed * concentration MTSES) for E79C. (C) Plot of the time constant (τ) of desensitization; (D) Plot of the relative peak current amplitude, which is fit with a single exponential used to obtain the modification rate constant. (E) Modification rate constants of E79C at pH 8, 7, and 6. The rate at pH 8.0, 226 M−1s−1, could be quantified, whereas rates when channels are desensitized (either pH 6.0 or 7.0) are below our limit of resolution, which was 1 M−1s−1.

