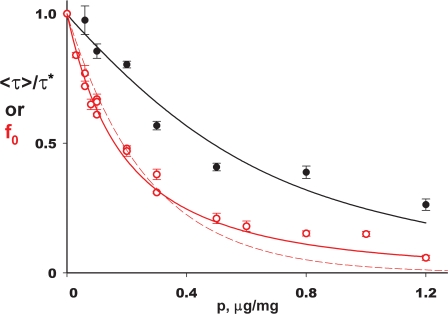
Figure 8.
Covariation of Poisson transport parameters. Average time constant 〈τ〉 normalized to its zero-protein value τ* (black points) and f0 (red points) are plotted against protein density. Solid black curve for time constant is according to Eq. 7. Curves (red) fit to f0 data are single exponential (dashed), Eq. 9a, or expanded theory (solid) accounting for heterogeneity in liposome radius, Eq. 10.

