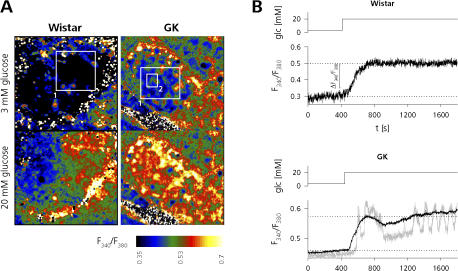
Figure 2.
Glucose elicits similar changes in the cytosolic Ca2+ concentration in healthy and diabetic rats. (A) Ratio images of Fura PE3-AM bulk-loaded Wistar (left, also see Video 1) and GK (right, also see Video 3) rat islets before (top images, t = 0 s) and after (bottom images, t = 1,800 s) application of 20 mM glucose (glc). (B) Mean pixel intensity data of ROI1 (black traces) and ROI2 (gray trace) shown in A. Dotted lines indicate the response amplitude.

