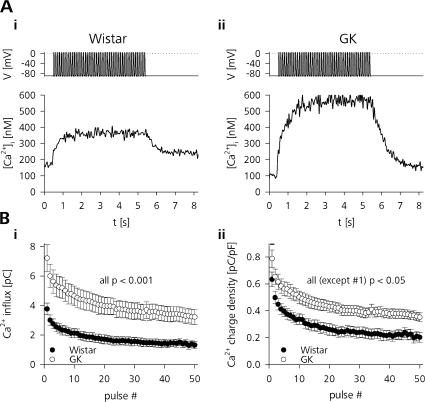
Figure 5.
Ca2+ influx during train stimulation is higher in GK rat β cells. (A) Depolarization train–evoked change in [Ca2+]i in (i) a Wistar and (ii) a GK rat β-cell measured by ratiometric imaging of cells loaded with 50 μM Fura-PE3. (B, i) Average Ca2+ influx for each depolarization pulse in control (closed symbols, n = 33) and diabetic (open symbols, n = 20) β cells measured as integrated Ca2+ current. (ii) Same as in i but normalized to the cell size (unpaired t test).

