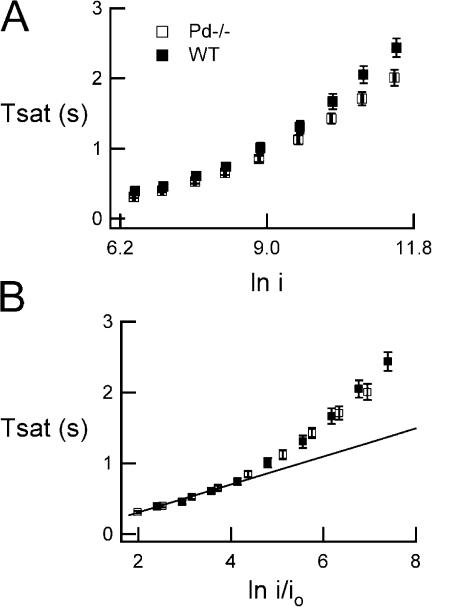
Figure 2.
Saturating flash responses of phosducin knockout rods show normal recovery kinetics. (A) The time that a bright flash response remained in saturation was plotted as a function of the natural log of the normalized flash strength (in photons/μm2). In mouse rods, this relation is linear up to ln i ∼9 (Chen et al., 2000), with the slope equal to the dominant time constant of response recovery (Pepperberg et al., 1992; Nikonov et al., 1998). (B) Normalizing for the difference in sensitivity between Pd−/− and WT rods (dividing the x-axis by the Io values for each individual cell) underscores the similarity of Pd−/− and WT recovery time constants across the entire range of tested flash strengths. The straight line, which has been fitted to the Pd−/− data points, has a slope of 0.198 s.

