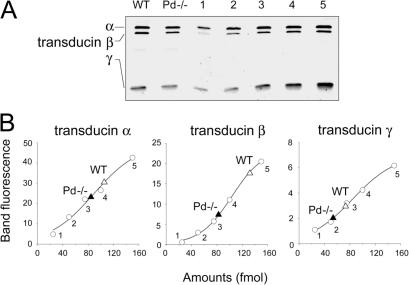
Figure 5.
Quantitative Western blotting of Pd−/− retinal extracts reveals decrease in transducin subunits expression. (A) Whole retinal extracts containing 100 fmol rhodopsin from WT and Pd−/− mice were separated on 10–20% polyacrylamide gels alongside 25, 50, 75, 100, 150 fmol purified transducin standard (1–5), and probed in Western blot analysis with antibodies against rod transducin subunits. (B) Fluorescence of the corresponding transducin standards bands from the top panel were plotted against the amounts of transducin in samples 1–5 (open circles), and fitted with sigmoid curves. Triangles represent the fluorescence of transducin bands from retina extracts. The number of determinations for each subunit is indicated in Table II.

