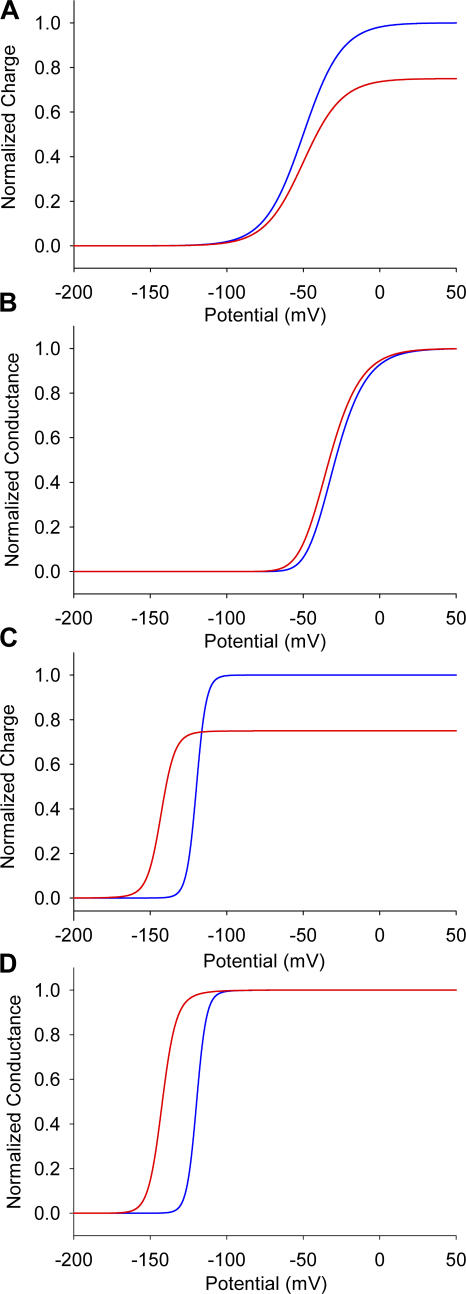
Figure 10.
Modulation of gating in independent and allosteric models. Simulations of the charge–voltage (A) and conductance–voltage curves (B) for the model with independent voltage sensors. Charge–voltage (C) and conductance–voltage (D) curves in the allosteric model, where all four voltage sensor movements are coupled. Toxin-modified data are shown as red lines, whereas the unmodified traces are shown as blue lines.

