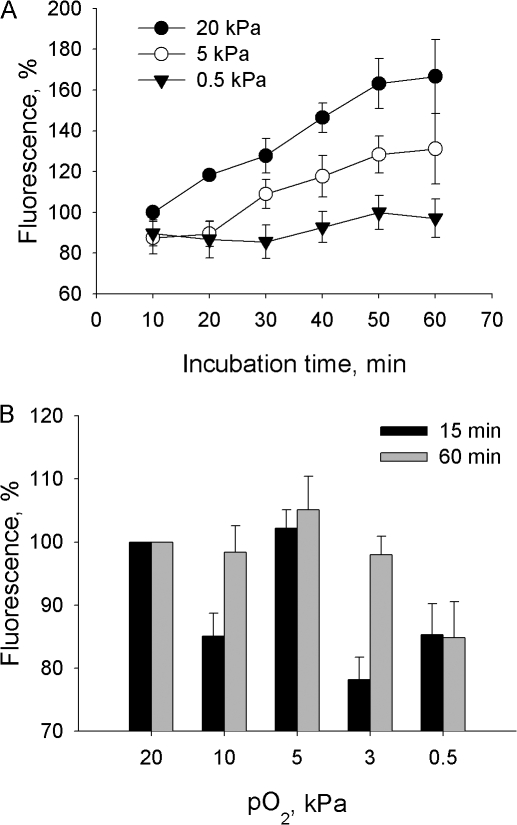
Figure 3.
(A) The rate of H2-DCF oxidation in cerebellar granule cells incubated at pO2 of 20, 5, or 0.5 kPa over 60 min detected by means of flow cytometry. Data are means of five independent experiments ± SEM normalized to the fluorescent signal immediately after loading. (B) Oxygen dose dependence of H2-DCF oxidation after 15 and 60 min of incubation at fixed pO2. Data are means of six independent experiments ± SEM normalized to the fluorescent intensity at the onset of incubation at fixed pO2 following 30 min of preincubation of cells loaded with fluorescent dye at pO2 of 20 kPa.

