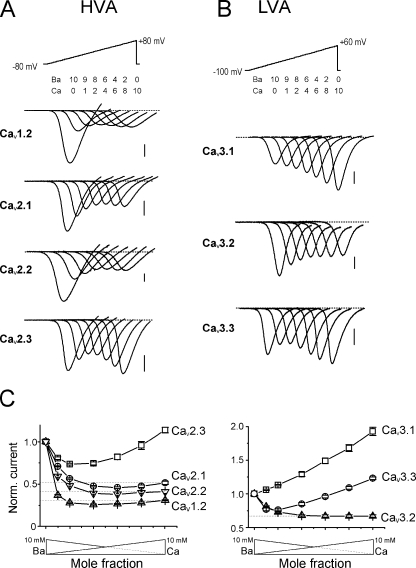
Figure 1.
Low and high voltage–activated Ca2+ channels have specific Ca2+/Ba2+ selectivities. (A and B) Representative current traces recorded in oocytes expressing HVA CaV1.2, CaV2.1, CaV2.2, or CaV2.3 and α2-δ + β2 Ca2+ channel subunits (A) or LVA CaV3.1, CaV3.2, or CaV3.3 Ca2+ channels (B) using solutions of different Ca2+ mole fractions (Ba2+/Ca2+: 10/0, 9/1, 8/2, 6/4, 4/6, 2/8, and 0/10 mM). Whole-cell currents were recorded during voltage ramps from −80 to +80 mV (A) or from −100 to +60 mV (B) at a speed of 0.4 to 2.6 V/s applied every 15 s. Bars, 100 nA. (C) Normalized current/mole fraction curves obtained from recordings similar to those in A or B by plotting the peak current of the IV curve against the Ca/Ba mole fraction. Note the different ICa/IBa ratios and the presence/absence of AMFE in each case. Left, averaged curves obtained from oocytes expressing CaV1.2 (▵), CaV2.1 (○), CaV2.2 (▿), or CaV2.3 (□) HVA VGCC. Right, curves obtained from oocytes expressing CaV3.1 (□), CaV3.2 (▵) or CaV3.3 (○) LVA VGCC.

