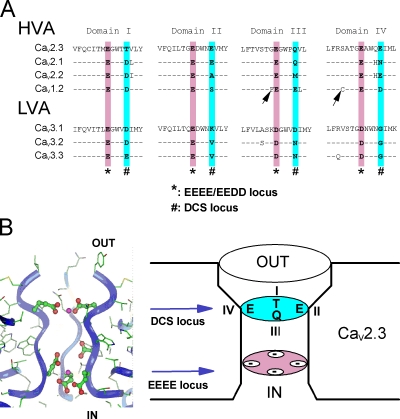
Figure 2.
Molecular modeling of the DCS and EEEE loci in the channel pore. (A) Sequence alignment of the P loops of CaV1.2, CaV2.1, and CaV2.3 HVA channels and CaV3.1, CaV3.2, and CaV3.3 LVA channels. * and # boxes, position of EEEE and DCS loci in each domain of the CaVα subunit. Note the nonconservation of the DCS charged amino acids. Arrows underline the non-DCS amino acids mutated in Fig S4: S1611 and G1323 in CaV2.3. (B) A molecular model of the C-terminal end of the four P loops of CaV2.3 channel. Left, radial projection of the channel with one of the domains omitted for the clearness of the picture. Right, schematic representation of the EEEE and DCS loci of CaV2.3 channel. Ribbons represent the backbone of the peptidic chains. Ca2+ ions are shown as magenta balls. Negatively charged side chains of the channel are shown by ball-and-stick representation (see Materials and methods for details).

