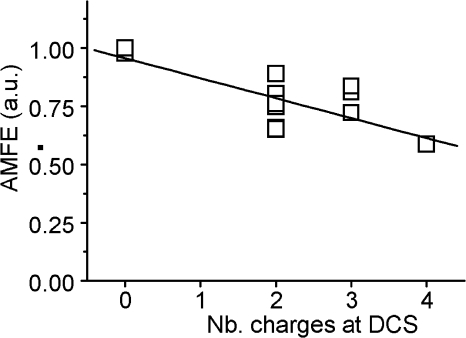
Figure 5.
AMFE amplitude is correlated with the number of negative charges at the DCS. Scatterplot showing the amplitude of AMFE (calculated as the minimum of the current–mole fraction curve divided by the current in 10 mM Ca2+) as a function of the number of negative charges for all the HVA mutations presented in this article.

