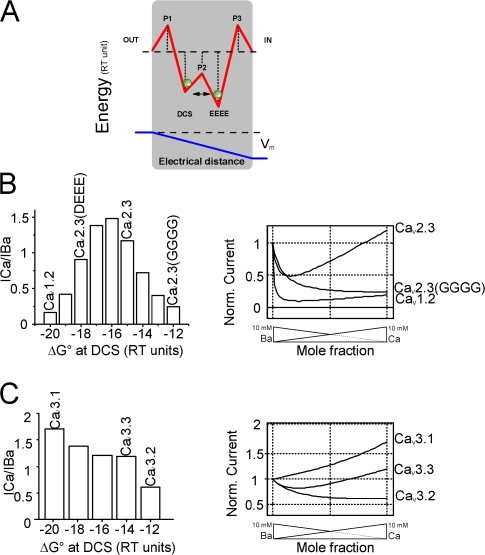
Figure 7.
Numerical computation predicts mutant behavior. (A) Schematic representation of the energy profile used for computer modeling of the three barriers–two sites channel model. Barriers (P1, P2, P3) and wells (DCS and EEEE) are spaced equally (see Materials and methods). Membrane voltage drops across the narrow portion of the channel. (B, left) Simulated ICa/IBa ratios calculated for decreasing free energies at the external DCS locus of the CaV2.3 channel. The bell-shaped relation obtained for the DCS locus reached a maximum when DCS ΔG° equals the energy of the internal site. (B, right) Simulated current–mole fraction curves with three out of the four decreasing DCS ΔG° depicted on the left. These curves were labeled CaV1.2, CaV2.3(DEEE), and CaV2.3(GGGG), after comparison with original traces shown in Figs. 1 and 3, and suspected variations in free energy at DCS locus due to mutation. (C) Simulated ICa/IBa ratios calculated for decreasing free energies at the external DCS locus of the CaV3.1 channel. Energy profile of CaV3.1 was first adapted from CaV2.3 by adjusting the ΔG° at the EEEE locus considering that this locus in LVA channels (EEDD) has lower affinity for Ca2+. Simulated current–mole fraction curves were then obtained by decreasing ΔG° at the DCS locus. Traces were labeled after comparison with original traces shown in Fig. 1 and suspected variations in free energy at DCS for the purpose of discussion.

