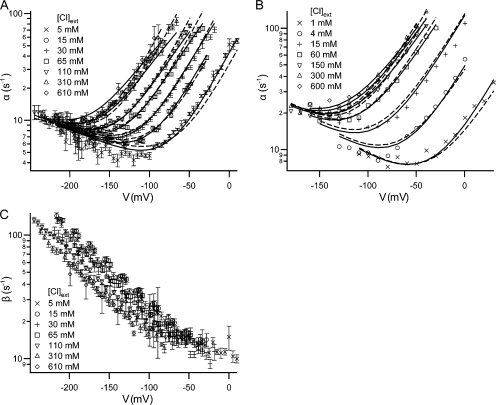
Figure 2.
Effect of voltage and external chloride on the kinetics of fast gating. (A and C) opening (α) and closing (β) rate constants for each test voltage. For test pulses (see examples in Fig. 1 A) where current decay could be seen, the decay was fit to a single exponential to derive the decay constant (1/τ). This was used in conjunction with the open probability (Po) to calculate α and β (Chen and Chen, 2001): α = P o/τ ; β = (1/τ) − α. For each condition (voltage (V), external chloride activity ([Cl]ext), we recorded from at least five patches and derived the rate constant for each patch. For the 610 mM chloride condition, we recorded two to five patches for each voltage. For a given condition, the rate constants from all patches were averaged; the error bars show the SEM. (B) For comparison, opening rate constant data were taken from the graphs published by Chen and Miller (1996) and replotted. (A and B) Each opening rate constant dataset was globally fit to the five-state model (Scheme 2, Eqs. S5–S8 in the online supplemental material) either holding z c constant (dashed lines) or letting all six parameters find their best-fit values (solid lines). In the case where z c was held constant, the values of z c (0.09 in [A] and 0.08 in [B]) were chosen based on the analysis using the Method 1 and the four-state model, where only a subset of voltages were included (see analysis in the supplemental material and parameter values in Fig. 3). The parameters derived from all of these fits are shown in Fig. 5.

