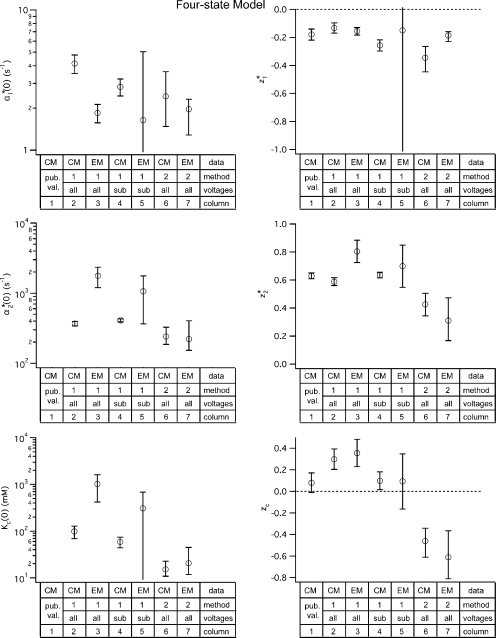
Figure 3.
Parameter values for the four-state gating model. Values for the four-state model parameters were derived for both the dataset published by Chen and Miller in 1996 (CM) and for the dataset we obtained using macroscopic recordings (EM). These parameter values were derived using two different fitting methods: (1) Method 1, used by Chen and Miller, shown in Figure S4; and (2) Method 2, globally fitting the opening rate constant as a function of voltage and external chloride (α(V, [Cl]ext)), allowing all six parameters to be free, shown as solid lines in Fig. S5, C and F. Method 1 was performed including either all the voltages (all) or some subset of the voltages (sub). For Method 1, the error bars show the standard deviation calculated by the fitting algorithm (for fits shown in Fig. S4, B and D); for Method 2, the error bars show the 95% confidence limits determined as described in the text. For comparison, the first column shows the parameter values (z 1 *, z 2 *, and z c) published by Chen and Miller (pub. val.); values for α1 *(0), α2 *(0), and K c(0) were not reported.

