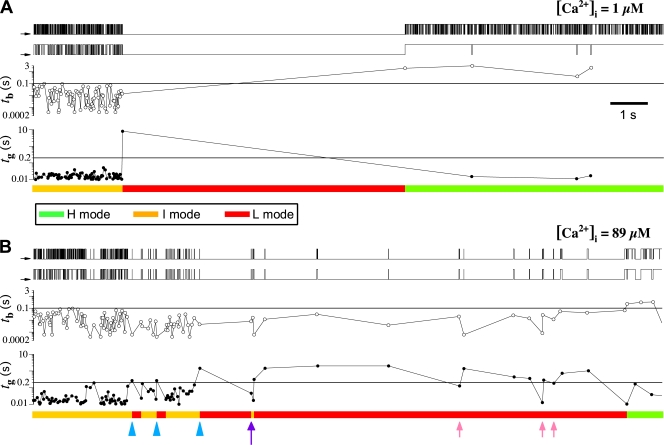
Figure 5.
Identification of InsP3R channel gating modes based on channel opening and closing durations. The single InsP3R channel current records were obtained in saturating 10 μM InsP3, and optimal (1 μM) and nonoptimal (89 μM) [Ca2+]i as tabulated. Each section consists of a set of five graphs derived from the same channel record. From the top: idealized current trace, idealized current trace after burst analysis, plot of channel burst duration t b vs. time when the channel opens, plot of channel gap duration t g vs. time when the channel closes, and the gating mode of the channel, determined as described in the text, with green, yellow, and red representing H, I, and L modes, respectively. The current traces were selected to show modal transitions among all three gating modes in one continuous recording under various [Ca2+]i.

