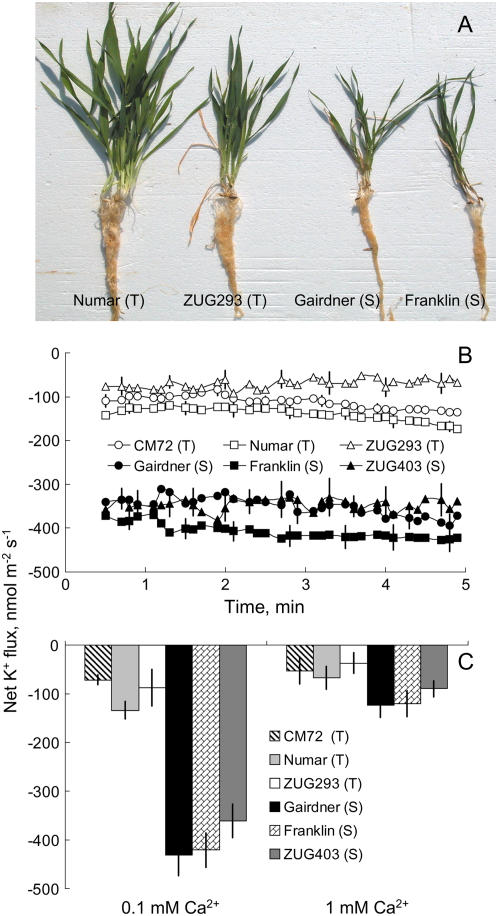
Figure 1.
A, Contrasting barley genotypes grown under 320 mm NaCl for 4 weeks in the glasshouse experiment. Salt-tolerant (T) and salt-sensitive (S) varieties are easily distinguished. B, Steady-state net K+ fluxes (inward positive). C, Effects of different external Ca2+ (0.1 and 1 mm) on NaCl-induced K+ flux measured from 3-d-old roots of barley genotypes contrasting in their salinity tolerance after 1 h of 80 mm NaCl treatment. Results in C are averaged over 15 min of K+ flux measurement. Means ± se (n = 7–10). [See online article for color version of this figure.]

