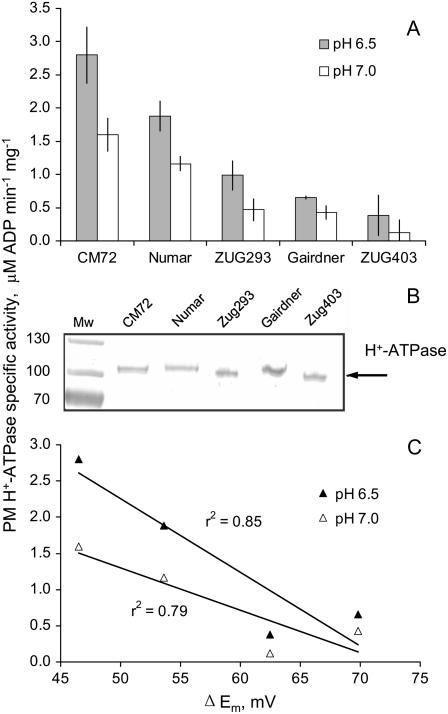
Figure 4.
A, ATP hydrolytic activity of PMs isolated from the microsomal fraction of roots of barley genotypes contrasting in salinity tolerance. Means ± se (n = 6). The statistics are based on two independent PM preparations and each of the preparations was tested three times with reproducible results. B, Western-blot results demonstrating that the observed difference in the H+-ATPase activity is not due to a difference in the enzyme level.

