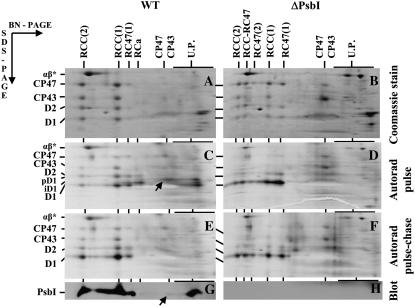
Figure 2.
Pulse-chase analysis of wild type and the psbI deletion strain ΔPsbI. Cells of wild type (A, C, E, and G) and ΔPsbI (B, D, F, and H) were radiolabeled at 500 μmol photons m−2 s−1 and 23°C with a mixture of [35S]Met/Cys for 10 min (pulse) and then CAP (1 mg mL−1) was added and cells incubated at the same temperature at 125 μmol photons m−2 s−1 for another 20 min (chase). Labeled cells were used for isolation of thylakoids, which were analyzed by 2D BN/SDS-PAGE. A and B, Coomassie Blue-stained gels of proteins after the pulse. C and D, Autoradiograms of the same samples with the putative D1-PsbI complex designated by arrow in C. E and F, Autoradiograms of proteins after pulse chase. G and H, Low-Mr region with PsbI detected by immunoblotting (blot) and putative D1-PsbI complex designated by an arrow. Designations of proteins are as described in the legend to Figure 1. RCC-RC47 designates dimeric PSII core complex lacking only one CP43 copy and RC47(2) the dimeric PSII core lacking both CP43 copies. U.P., Unassembled proteins. α- and β-subunits of ATP synthase (designated by αβ*) were used as internal standards during quantification of D1-stained and -labeled bands (see Supplemental Table S2). The arrows in C and G show the complex of PsbI and pD1 in wild type. Six micrograms of Chl was loaded for each sample.

