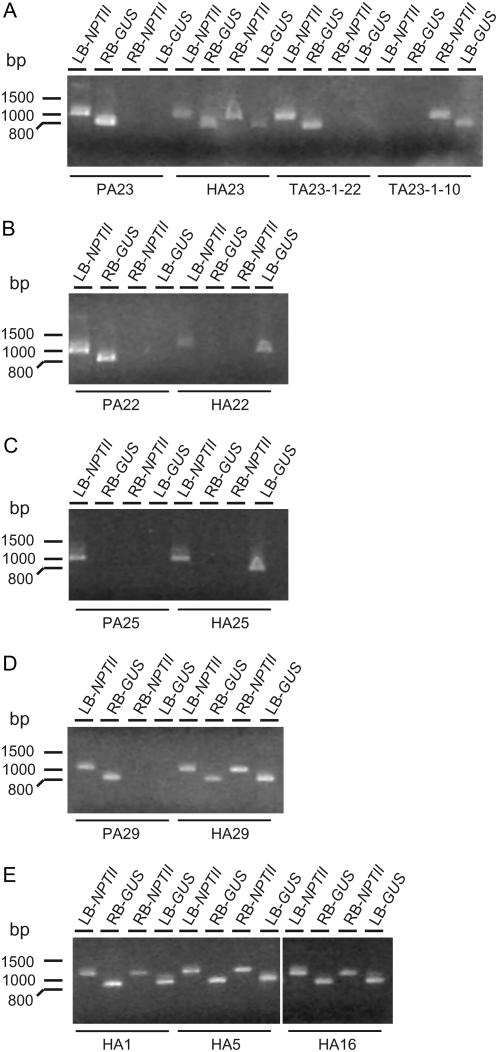
Figure 5.
PCR analysis to identify the newly formed T-DNA configurations. PCR analysis on DNA of parental, hybrid, and progeny plants of A23 (A), A22 (B), A25 (C), A29 (D), and HA1, HA5, and HA16 (E) is shown. Ten microliters of PCR product was loaded on a 1% agarose gel. On top of each lane, the name of the transformant and the corresponding PCR reaction are given. LB-NPTII, Primer combination ch52 + pr7 amplified an LB-NPTII junction of 1,142 bp; RB-GUS, primer combination ch51 + pr1 amplified an RB-GUS junction of 905 bp; RB-NPTII, primer combination ch51 + pr7 amplified a RB-NPTII junction of 1,133 bp; LB-GUS, primer combination ch52 + pr1 amplified an LB-GUS junction of 914 bp.

