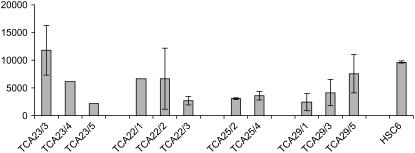
Figure 8.
mRNA expression analysis of P35S-CRE in progeny seedlings and the CRE-expressing line HSC6. mRNA accumulation levels in seven to 10 pooled 2-week-old seedlings were determined by real-time PCR with ACTIN2 as constitutive control. The fold difference of expression in the analyzed lines compared to untransformed control is shown. Error bars are sd of two biological repeats.

