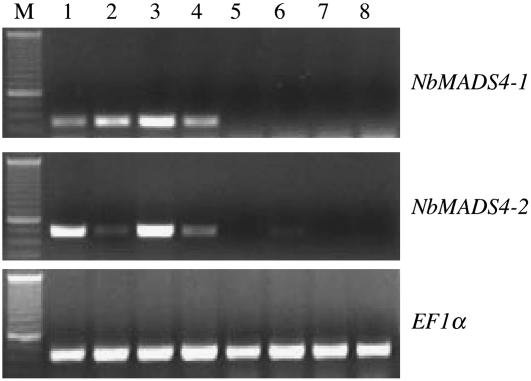
Figure 6.
Analysis of NbMADS4 tissue-specific expression. NbMADS4-1 and NbMADS4-2 transcripts were detected by semiquantitative RT-PCR. Lane 1 is tissue from sepals, 2 is petals, 3 is petioles, 4 is carpels, 5 is roots, 6 is stems, 7 is leaves, and 8 is seedlings. Lane M is the size marker. EF1α was used as a loading control.

