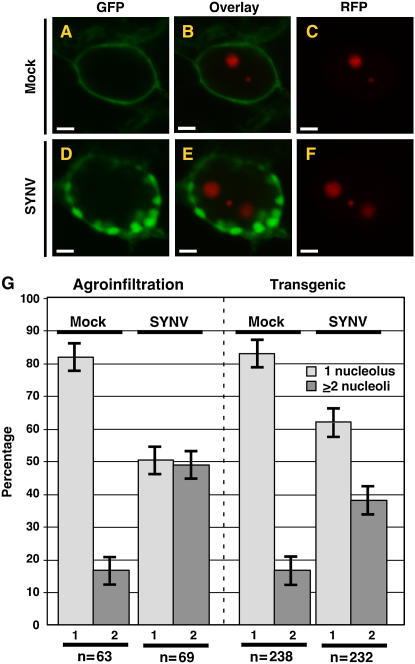
Figure 4.
A to F, Laser scanning confocal micrographs of N. benthamiana leaf epidermal cells showing shift in the localization of expression patterns of the RFP:AtFib1 nucleolar marker from two loci in mock-inoculated cells (A–C; mock) to three in SYNV-infected cells (D–F; SYNV). Transient expression of RFP:AtFib1 was conducted in mGFP5-ER plants. G, Quantitative comparison of RFP:AtFib1 expression patterns in mock-inoculated and SYNV-infected cells. Expression patterns were divided into two categories: nuclei with one nucleolus (1, light gray), or two nucleoli (2, dark gray). Results obtained using agroinfiltration are shown on the left while those obtained with transgenic plants are on the right. The numbers of nuclei examined (n) are shown at the bottom of the graph. Sections A to F and agroinfiltration data in G are reprinted from Chakrabarty et al. (2007).

