
Fig. 1.
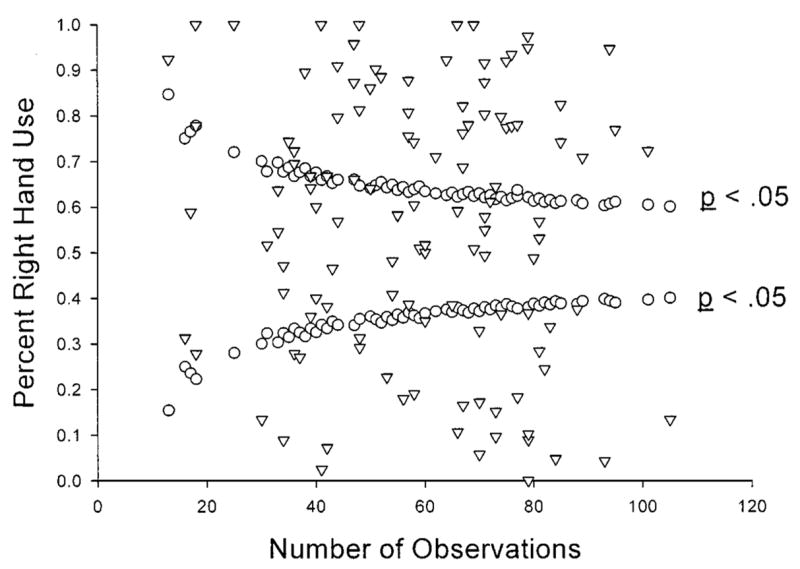
Funnel-graph of the percentage right hand use for all subjects plotted against the minimum number of responses needed to be classified as right- or left-handed based on z-scores. All data points falling within the funnel portion of the graph represent subjects classified as ambiguously-handed.