Fig. 4.

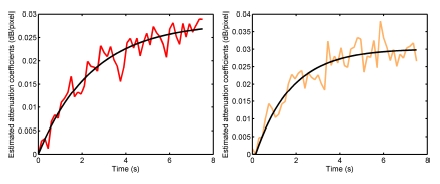
Exemple of replenishment curves in the proximal kidney (left) and in the distal kidney (right) extracted from attenuation images. The same ROIs as those on Fig. 3 were used.

Exemple of replenishment curves in the proximal kidney (left) and in the distal kidney (right) extracted from attenuation images. The same ROIs as those on Fig. 3 were used.