
Fig. 1.
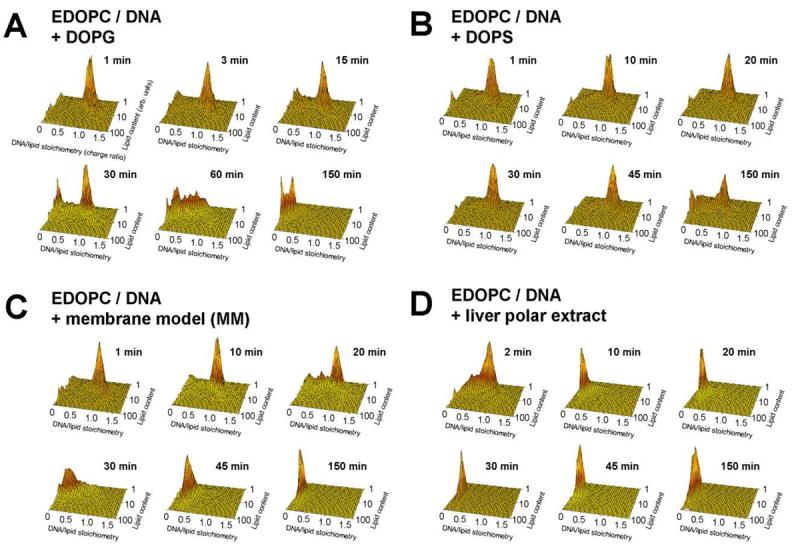
Plots of DNA/lipid stoichiometry (charge ratio) vs. cationic lipid content (arbitrary units) as reported by flow fluorometry, showing the time-course of DNA unbinding from EDOPC lipoplexes after addition of negatively charged liposomes: (A) DOPG; (B) DOPS; (C) membrane model mixture MM (MM=DOPC/DOPE/DOPS/Chol 45:20:20:15 w/w); (D) polar lipid extract from bovine liver (Avanti Polar Lipids). The stoichiometry (Y) axis represents the ratio of DNA to lipid charges in the particle. Lipoplexes contained cationic lipid labeled with 2.5% BODIPY-FL, and DNA labeled with the high affinity label, ethidium homodimer-2 (EthD-2) at 60 bp/dye. The panels show the distribution of stoichiometry vs. lipid content [15,16] after different times of incubation at room temperature, as indicated. Lipoplexes were initially prepared at near the isoelectric lipid/DNA ratio; negatively charged liposomes were added at a 1:1 weight ratio to the cationic lipid. In the usual case, particles that become more fluorescent are simply becoming larger. Since the fluorophore remains associated with the lipid, when two particles fuse or bind together, the resultant particle contains the fluorescence of both initial particles. Data in each panel were collected on 10,000 particles within less than 1 min.