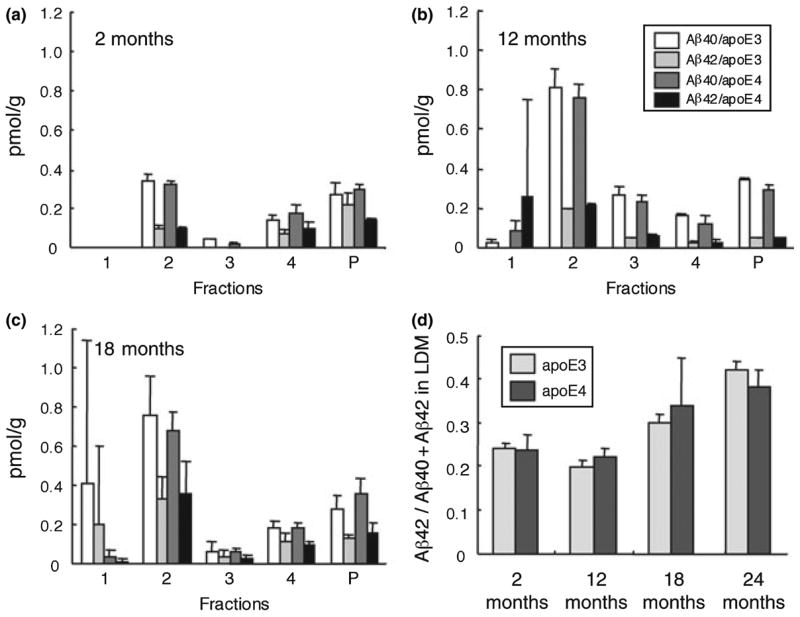
Fig. 1.

Quantification of Aβ40 and Aβ42 in the fractions obtained by sucrose density gradient centrifugation of the homogenates from apoE3 and apoE4 KI mice at two (a), 12 (b), and 18 months of age (c). Each fraction was diluted and centrifuged (see ‘Materials and methods’ section). The resulting pellet was extracted with guanidine-HCl, and the concentrations of Aβ40 and Aβ42 in the extract were measured by ELISA. Fraction 2 represents low-density membrane (LDM) domains. Data are presented as means ± SD (n = 3 for 2- and 12-month-old mice, n = 5 for 18-month-old mice). Open bars, Aβ40 concentrations in apoE3 mice; light gray bars, Aβ42 concentrations in apoE3 mice; dark gray bars, Aβ40 concentrations in apoE4 mice; black bars, Aβ42 concentrations in apoE4 mice. Panel (d) shows the proportion of Aβ42 to the sum of Aβ40 and Aβ42 in LDM fraction (fraction 2) at each age, including 24 months of age (n = 3). Light gray bars, apoE3 mice; dark gray bars, apoE4 mice.
