Figure 1.

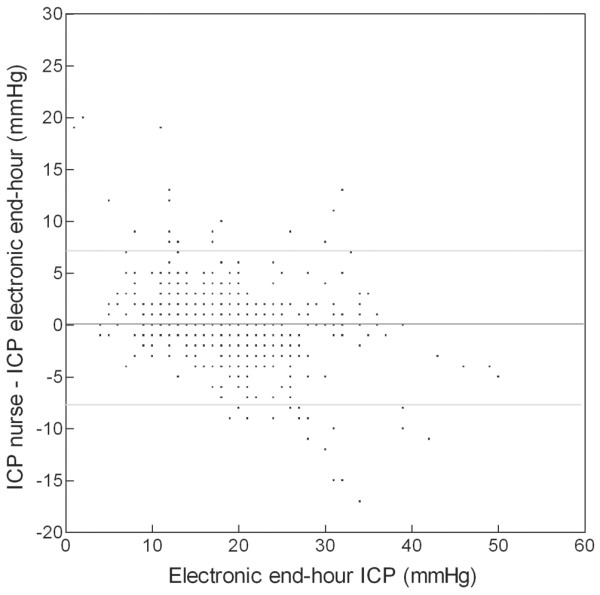
Bland and Altman's graph for end-hour intracranial pressure (ICP). The dark line shows the mean difference between manual and digital recording methods (0.05 mm Hg). The two light lines show the limits of agreement (-7.28 and +7.37).

Bland and Altman's graph for end-hour intracranial pressure (ICP). The dark line shows the mean difference between manual and digital recording methods (0.05 mm Hg). The two light lines show the limits of agreement (-7.28 and +7.37).