Figure 2.

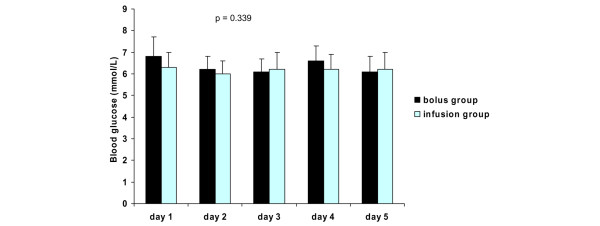
Blood glucose levels (mean ± standard deviation) in the study groups. P values represent the difference between the study groups (analysis of variance).

Blood glucose levels (mean ± standard deviation) in the study groups. P values represent the difference between the study groups (analysis of variance).