
Figure 2.
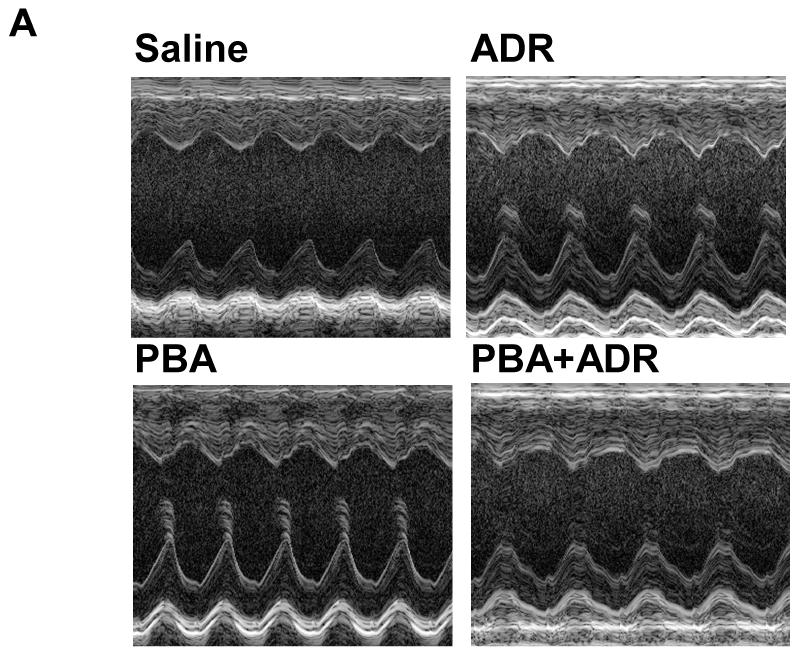


Echocardiograhic analysis of cardiac function. The mice were treated with saline (N = 5), ADR (N = 7), PBA (N = 5), and PBA+ADR (N = 7), respectively. Echocardiographic images were taken after the mice being anesthetized with 2% isoflurane. Short axis motion mode (M-mode) images were recorded at the papillary muscle level for cardiac functional analysis (A). Changes of ejection fraction (B) and fraction shortening (C) were plotted as percentage changes of the basal line values. Data were represented as mean ± SEM * P < 0.05 compared with saline, PBA, and PBA+ADR.