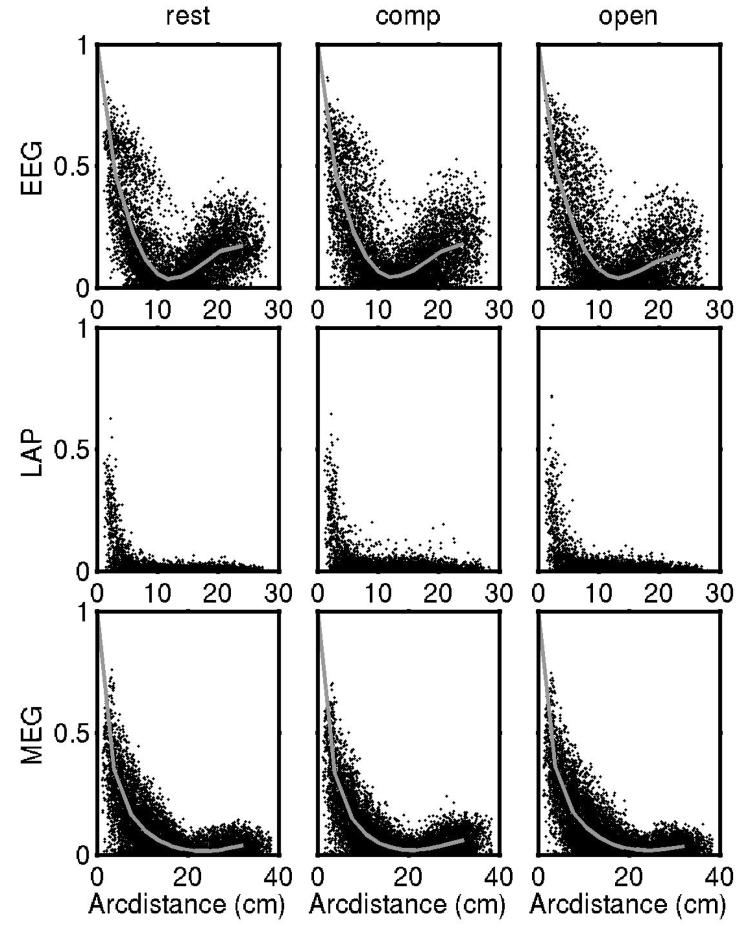
Figure 5.
Experimental coherence at 45 Hz plotted is versus sensor or electrode separation in each column for each of three brain states (eyes closed resting, eyes closed computation, eyes open resting) and for the three measures in each row. Coherence was calculated for all possible pairs of the 127 electrodes and 148 magnetic coils (8001 and 10,878 coherence estimates, respectively). The 18 edge electrodes were omitted from the Laplacian estimates yielding 5886 coherences. The gray curves superimposed on each scatter show the average coherence at each distance. The EEG (upper row) has elevated coherence at short to moderate electrode separations falling to a minimum at around 12 cm in all three experimental conditions with the rise at higher distances also observed in all three cases (due to negative potentials generated by radial dipoles). The Laplacian coherence (middle row) shows very low coherence in all three brain states except at very close (< 3 cm) electrode separations. MEG coherence (lower row) represents the intermediate case; it falls off somewhat faster than the EEG coherence, but slower than the Laplacian coherence.

