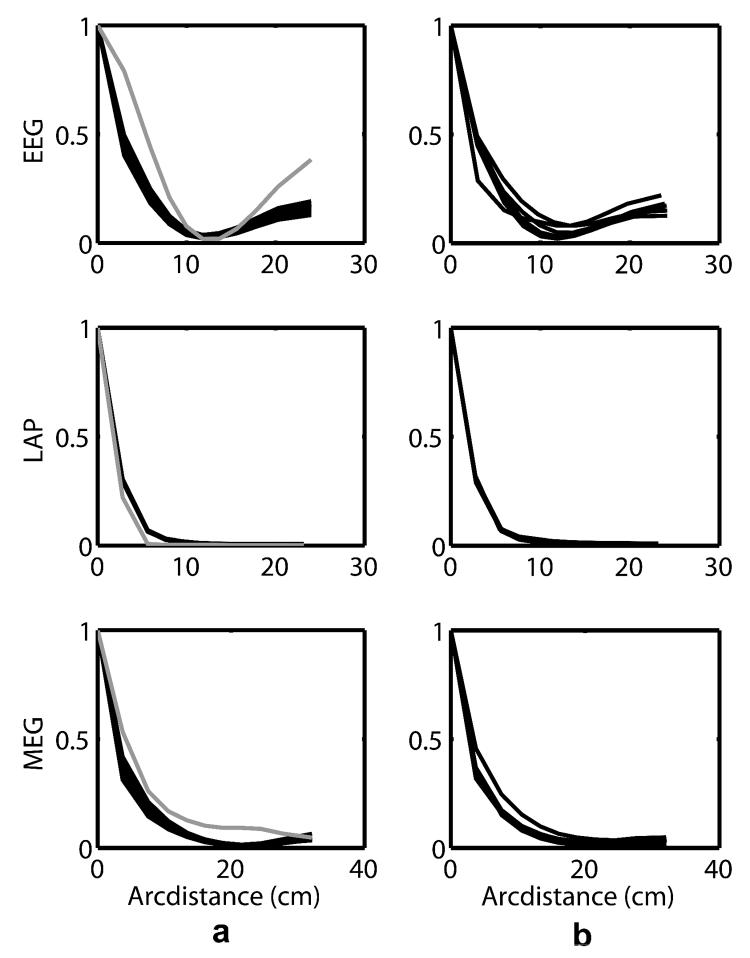
Figure 6.
(a) The average (over the 40 to 50 Hz range) coherence-distance relationship is plotted in one subject for the EEG (upper), Laplacian (middle) and MEG (lower) measures. The grey curve is the simulated coherence for this subject based on his (MRI estimated, white noise) dipole source orientations in the 3-ellipsoid head model. (b) The coherence-distance relationship averaged over the 40 to 50 Hz band in each of the six subjects showing very little difference between subjects.

