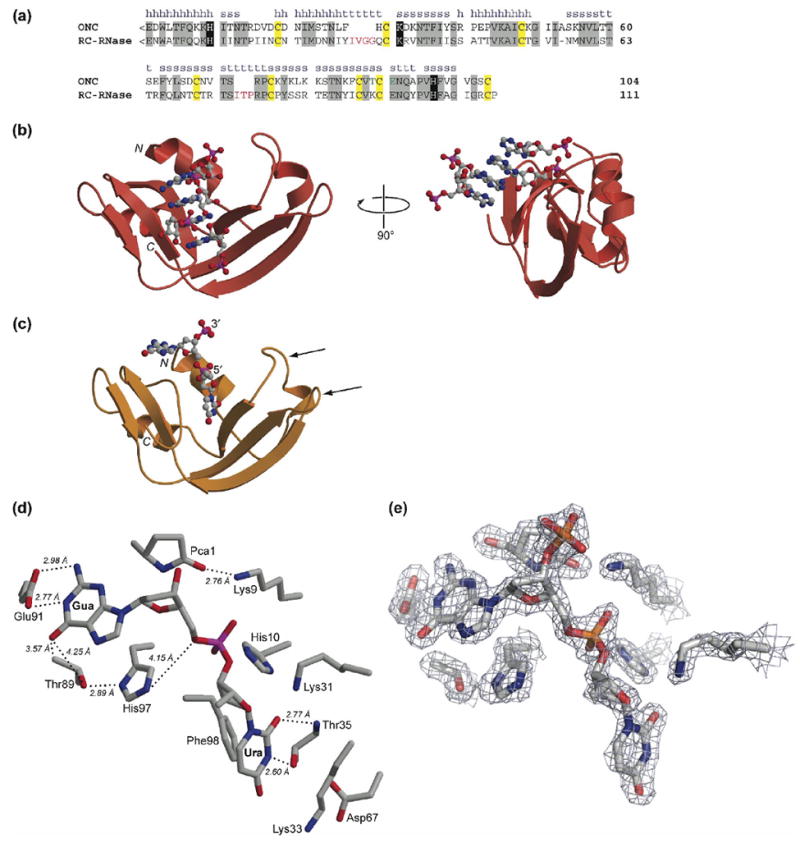
Figure 1.

Primary and tertiary structure of ONC. (a) Amino-acid sequence alignment of ONC and RC-RNase. The secondary structure of ONC is labeled as h (α-helix), s (β-strand), or t (turn). Residues conserved between the two ribonucleases are in gray boxes. <E denotes a pyroglutamate residue. Key active-site residues are in black boxes. Cysteine residues that form intramolecular disulfide bonds are in yellow boxes. Residues that participate in the nucleobase recognition at the B2 subsite in ONC are in green. Extra amino acid residues in the loops of RC-RNase are in red. (b) Ribbon diagram of the three-dimensional structure of the T89N/E91A ONC·5′-AMP complex (PDB entry 2GMK). (c) Ribbon diagram of the three-dimensional structure of the ONC·d(AUGA) complex (PDB entry 2I5S). The two flanking adenosine nucleotides are not included in the diagram because of their low electron density. The two arrowheads indicate the two loops that were subjected to elongation herein. (d) Stick diagram of the active site and B1 and B2 subsites in the ONC·d(AUGA) complex. Thr35 forms two hydrogen bonds with the uracil nucleobase. Glu91 forms two hydrogen bonds with the guanine nucleobase. Thr89 is located close to the carbonyl oxygen of guanine. (e) Electron density map of the active site (σ-weighted 2Fo – Fc) contoured at 1.5σ over background. Images in panels (b)–(e) were created with the program MOLSCRIPT and rendered with the program RASTER3D.79
