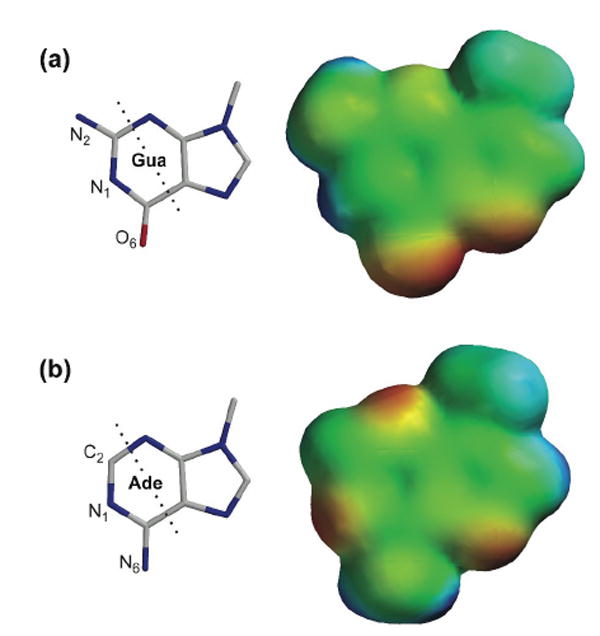
Figure 5.

Structure and electron density diagram of (a) 9-methylguanine and (b) 9-methyladenine. Atoms to the left of the dashed lines interact with Thr89 and Glu91 of the B2 subsite of ONC (Figure 1(d)). Electron density of the nucleobases was calculated with the program SPARTAN (Wavefunction, Irvine, CA). Electron-rich regions are colored red; electron-poor regions are blue; neutral regions are green.
