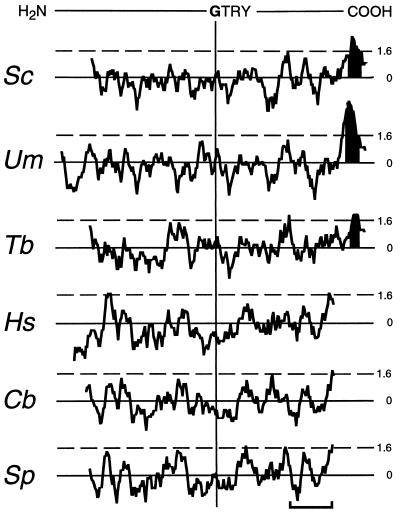
Figure 2.
Hydropathy plots of Dol-P-Man synthases. Plots were generated according to Kyte and Doolittle (22) with a window of 11, using the dna strider 1.1 program (20). Plots are aligned to the Gly-Thr-Arg-Tyr (GTRY) sequence conserved in all Dol-P-Man synthases. Stretches of amino acids with hydropathies above 1.6 (---) may form transmembrane domains. Transmembrane sequences predicted by the program of Rost et al. (23) are shaded in black. (Bar = 50 amino acids.)

