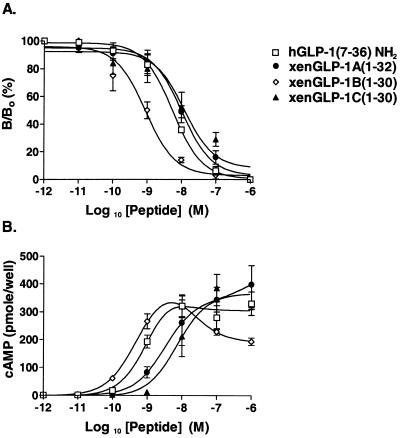
Figure 3.
(A) Displacement of [125I]-htGLP-1 from CHO cells stably expressing the hGLP-1R, comparing hGLP-1 with the Xenopus peptides xenGLP-1A(1–32), xenGLP-1B(1–30), and xenGLP-1C(1–30). All curves were fit to a one-site model and are representative of n ≥ 3 independent experiments. (B) Stimulation of cAMP accumulation in CHO cells expressing hGLP-1R in response to hGLP-1, xenGLP-1A, -1B, or -1C (n ≥ 3 for each peptide). Data were fit to fixed-slope dose-response curves. The IC50s and EC50s are summarized in Table 2.

