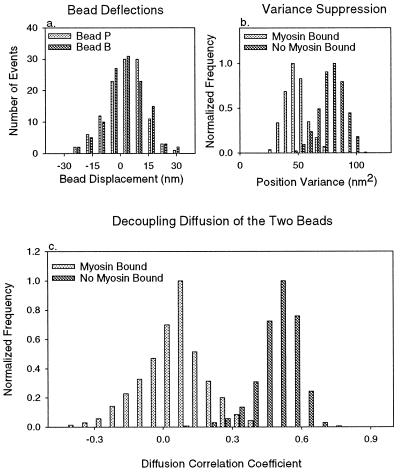
Figure 3.
(a) Tabulation of bead deflections, after elimination of outliers in the variance distributions (see Appendix) and including only binding events bordered by 100-ms baseline regions with mean positions less than 3 nm apart. The remaining 112 points have been corrected for displacement absorbed by compliant bead/filament connections. Independent measurements of the stroking distance on either side of the filament yield distributions centered about 4.1 ± 0.8 nm for bead B and 5.3 ± 0.9 nm for bead P. The uncertainties are calculated by the method of maximum likelihood, assuming that all errors are statistical, and do not account for possible systematic errors such as that which might be caused by the random relative orientation of surface-bound myosin and the actin filament. Both distributions have a variance of 79 nm2, the same as the variance of baseline Brownian motion, consistent with the postulate that variance in bead deflection amplitudes is caused by myosin binding to the actin filament anywhere in its range of diffusive motion with equal probability (5). Total position variance within each event and 100-ms baseline interval was measured. b shows position variance distributions for bead P, after removal of outliers (see Appendix). Myosin clearly suppresses the position variance, and the values with myosin bound are centered about 48.3 ± 0.5 nm2 and 46.3 ± 0.5 nm2 for beads P and B (not shown), respectively. All uncertainties are computed using a maximum likelihood fit to a normal distribution and computing the change in mean, causing an increase of reduced χ2 by 1. Using equipartition of energy (3), we computed the elastic constraints upon beads P and B as 0.08 pN/nm and 0.09 pN/nm. Subtracting trap strength, we estimated the elements connecting each optically trapped bead to the slide surface through the myosin molecule to have combined stiffness of around 0.05 and 0.06 pN/nm for the actin/bead assembly used in this experiment. The 0.027-pN/nm series combination of these agrees with the value computed from correlated diffusion (Fig. 4 legend), indicating that the bead-to-filament connection is much weaker than all other elements in the optically trapped bead-to-surface linkage. b also shows the position variance distribution for bead P without attached myosin. Such distributions are centered about 79 nm2 and 87 nm2, respectively, again with very small uncertainties, indicating respective constraints of around 0.05 pN/nm on each bead. Position variances in regions just before myosin binding and just after release were uncorrelated, indicating that the distribution spread probably reflects statistical fluctuation rather than actual changes in the elasticity of the system. With no myosin attached to the actin, each bead is constrained by a parallel combination of its trap and the other trap in series with the link between the beads. The values one computes from these parameters are 0.05 and 0.04 pN/nm, which are very close to those measured. (c) The distribution of measured diffusion correlation coefficients, each for a 100-ms interval preceding or following each myosin-binding event, after outliers in the position variance distributions have been removed (Fig. 2 legend). Independent analysis of regions before and after the events gave two essentially identical diffusion correlation coefficient distributions. With no myosin bound, the mean value is 0.45 with an uncertainty of 0.005. The distribution of measured correlation diffusion coefficients in regions where a myosin is bound, after removal of outliers in the position variance distributions, is centered at about 0.05 with an uncertainty of 0.01. The uncertainty range assumes that errors in the data are statistical and not systematic.

