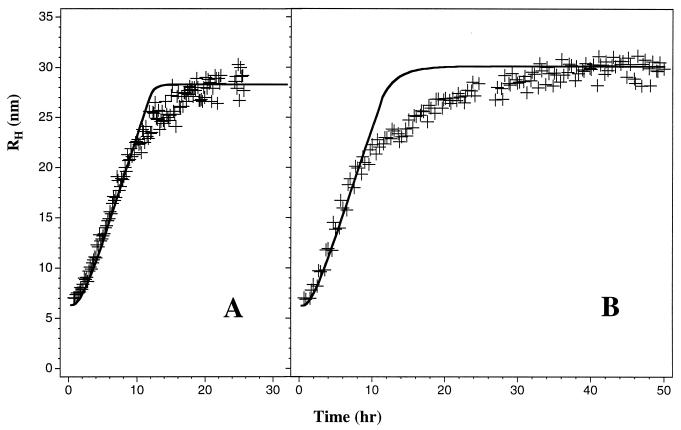
Figure 4.
Comparison between temporal evolution of the samples with Aβ concentration 1.16 mM (A) and 0.47 mM (B) observed experimentally in 0.1 M HCl (+) and calculated using the simple analytic theory (solid curves) with the following parameters: kn = 2.4 × 10⁻⁶ sec−1, ke = 90 M−1⋅sec−1, m0 = 25, c* = 0.1 mM, and n0 = 10. One percent of the protein was assumed to be in the form of seeds: n0N0 = 0.01C.

