
Figure 3. Time- and dose-dependent changes in biological pathways affected by WY-14,643 in mouse liver.
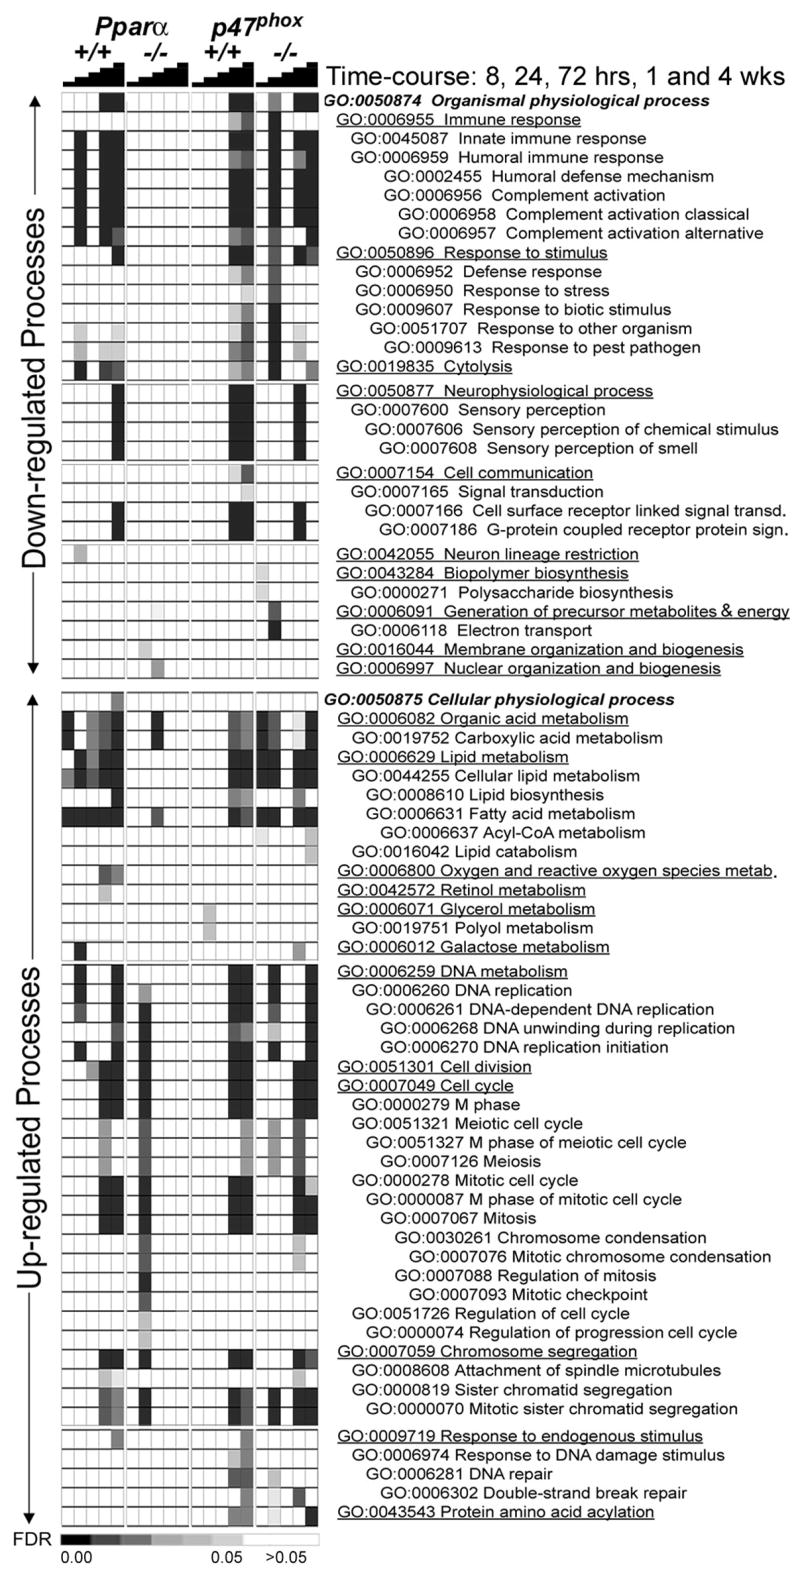
Significant genes from EDGE analysis (Figure 3) were used to identify enriched biological processes affected by WY-14,643 treatment. Supervised hierarchical clustering was used to organize treatments and strains (columns) and biological processes (rows). Processes that were down- (top half) and up- (bottom half) regulated were analyzed separately. Heat map shading reflects the significance (based on false discovery rate statistics, FDR) for a given pathway. The pathways are ordered within each category according to Gene Ontology hierarchy.