
Fig. 5.
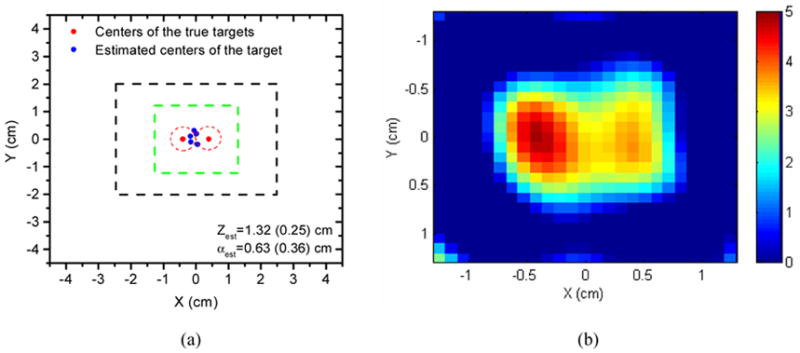
Reconstruction results of two targets: (a) Reconstructed structural parameters; the red dash circles in (a) represent the positions of the two targets and the blue dots are the estimated positions. The green dashed square indicates the target region and the black dashed square shows the region where the sources and the detectors are distributed. (b) Reconstructed fluorophore concentration distribution within the region marked by the green dashed square in (a). Note the image size is 3 cm by 3 cm, which is 1/3 of the image size used in Fig. 4 for each slice.